
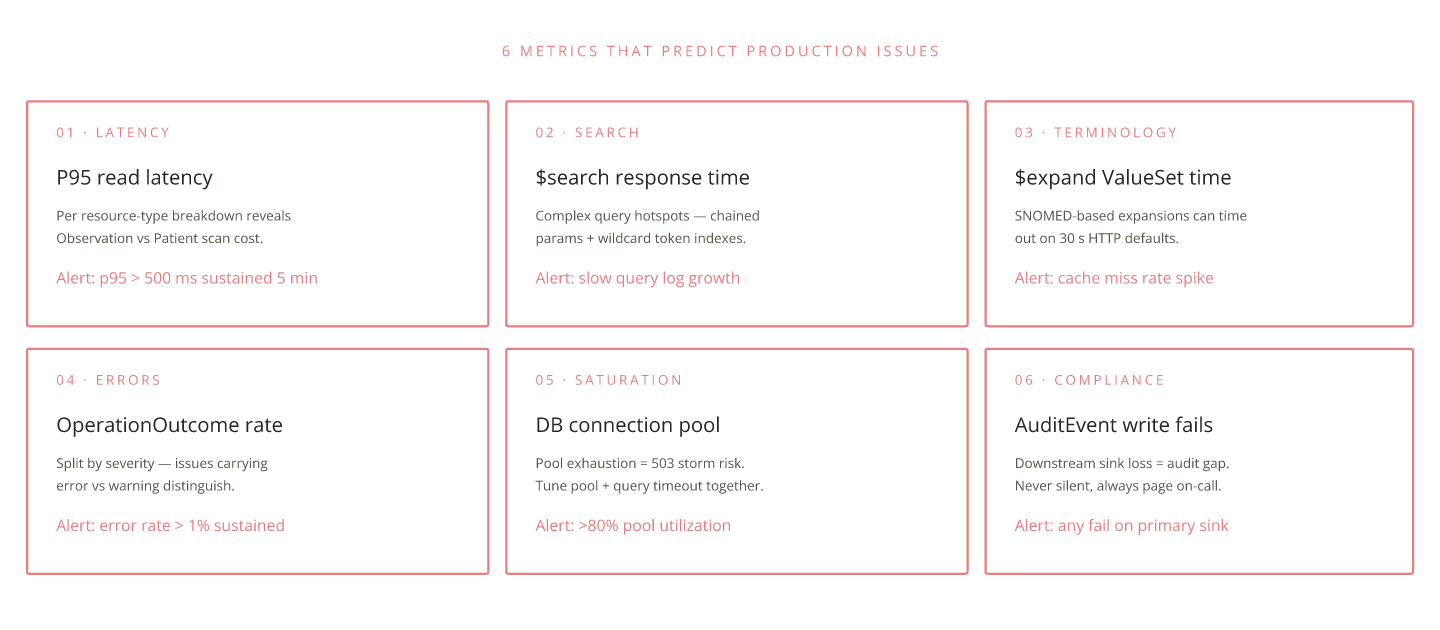
Prometheus metrics for FHIR servers should track more than CPU and memory. Six operational metrics predict production incidents before they become outages.
1. $validate pass rate. Percentage of writes passing validation. Dropping <95% signals upstream data quality regression. Track per resource type.
2. Postgres connection pool utilization. FHIR write throughput is often gated by connection pool. Sustained >80% predicts write latency spikes. Tune pool size + pgbouncer if using HAPI JPA.
3. Bulk export queue depth. Number of pending `$export` jobs. Sustained growth predicts export SLA breaches. Alert on queue depth exceeding 2× typical.
4. Search parameter cache hit rate. FHIR search parameter execution benefits from parameter caching. Drops predict schema drift or new query patterns.
5. Terminology $expand latency. Terminology server response time per operation. Rising latency predicts terminology-side issues before they affect writes.
6. Subscription delivery success rate. Subscription rest-hook delivery success. Drops indicate subscriber-side issues or network problems.
Alert thresholds (production baseline)
| Metric | Warning | Critical |
|---|---|---|
$validate pass rate |
<97% | <95% |
| Postgres pool utilization | >70% | >85% |
| Bulk export queue | >5 pending | >20 pending |
| Search cache hit rate | <70% | <50% |
| Terminology latency | >100ms | >300ms |
| Subscription success | <98% | <95% |
Instrumentation approach
Aidbox FHIR server and Medplum expose these metrics natively via Prometheus scraping. HAPI FHIR exposes JMX; use a Micrometer bridge to Prometheus.
Dashboards to build
1. Request rate per resource type + method 2. $validate pass rate over time 3. Postgres connection pool + wait time 4. Bulk export job lifecycle timeline 5. Terminology operation latency histogram
FHIR server monitoring is a solved discipline in 2026 with the right metrics. Getting the six above onto dashboards eliminates most incidents-before-outages.
Related Posts