
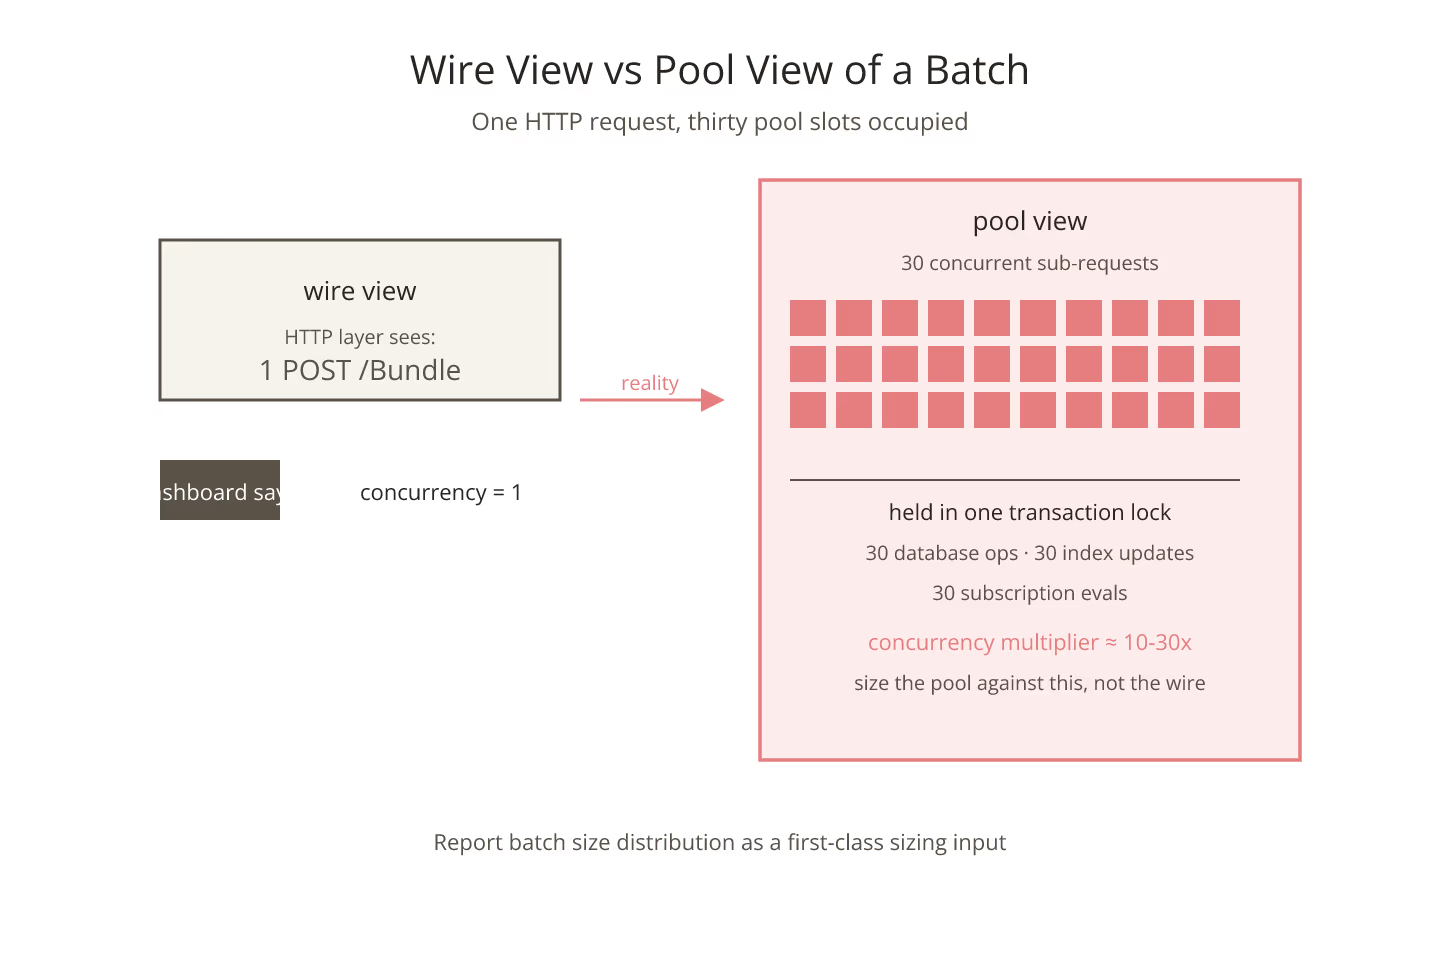
Batch endpoints look like one request from the concurrency dashboard. Each POST to /Bundle produces one HTTP entry, one auth check, one line in the request log. The dashboard shows a modest concurrency number and the sizing plan looks comfortable. The dashboard is telling the truth about the wire; it is understating the pool by an order of magnitude.
Naming the skew is the discipline that keeps the batch-endpoint conversation honest. For related walkthroughs, more on healthcare data exchange in the USA collects the surrounding material.
What Actually Runs Inside a Batch
A transaction Bundle of thirty entries produces one HTTP request and thirty database operations. Every sub-request holds a connection slot; every sub-request takes its own time; every sub-request contributes to the pool utilization.
The wire dashboard sees one request in flight. The pool dashboard sees thirty. A pass through the site's concurrency p99 predictor can bracket the difference when the batch multiplier is entered explicitly.
The Concurrency Multiplier
Little's Law still holds inside the batch. If the average sub-request takes fifty milliseconds and the batch runs sub-requests in parallel across ten workers, the batch itself takes about a hundred fifty milliseconds and occupies ten pool slots concurrently.
The multiplier is not exact; it depends on how the FHIR server dispatches sub-requests. But it is closer to ten than to one. Sizing plans that treat batches as one-request-one-slot events undercount pool demand by that multiplier.
The Lock Scope Interaction
Transaction Bundles hold a lock across the entire batch. While the transaction is running, no other write to the same resources can proceed. A ten-entry transaction that takes two hundred milliseconds serializes writers for that window.
Lock scope is invisible from the HTTP layer. It is very visible from the pool and the database. For the database-side story, why active users are not the same as concurrent requests covers similar hidden multipliers.
Batch Traffic Should Have Its Own Line
Sizing plans that carry a single concurrency number for the API miss the batch skew. Plans that split by workload class (interactive vs batch vs export) surface it and let sizing account for it.
The disciplined pattern is a per-workload concurrency budget, with batch traffic named as its own line. For the interactive-versus-batch pool contention, background jobs vs interactive requests in the same FHIR pool covers the split pattern.
Batch Size Matters More Than Batch Rate
A workload that sends a thousand Bundles per hour with two entries each is very different from one that sends a hundred Bundles per hour with thirty entries each. Both produce the same wire RPS; the second one produces ten times the pool concurrency.
Report batch size distribution as part of the sizing input. The ninety-fifth-percentile size is usually the number to size against.
The Test Reveals the Skew
Load testing that fires realistic batch sizes surfaces the skew immediately. Testing with unrealistically small batches misses it entirely. For the wider prediction framing, predicting concurrency for a FHIR API before you have real users covers the shape.
Batch endpoints are legitimate workloads with their own concurrency signature. Every FHIR deployment that supports batch traffic benefits from naming the skew rather than discovering it during the first ingestion peak.
Sources
- HL7 FHIR core specification of Bundle covering batch and - HL7 FHIR core specification of Bundle covering batch and transaction expansion semantics
Related Posts