
Sizing meetings almost always start with a user count. The vendor asks how many users the FHIR API will serve; the answer becomes the target for the capacity plan; the plan is sized against that number. The trap is that active users and concurrent requests are different quantities, and treating them as interchangeable produces plans that under-size or over-size by an order of magnitude.
Naming the difference is the discipline that gets sizing conversations unstuck. For related walkthroughs, more FHIR implementation patterns collects the surrounding material.
What Active Users Actually Measure
Active users measure how many humans are inside the workflow during a given window. If a hospital has three hundred nurses using the FHIR-backed chart-review app during morning rounds, that is three hundred active users.
Vendors quote user counts because the number is stable and easy to sell against. It is also almost never the right sizing input on its own.
What Concurrent Requests Actually Measure
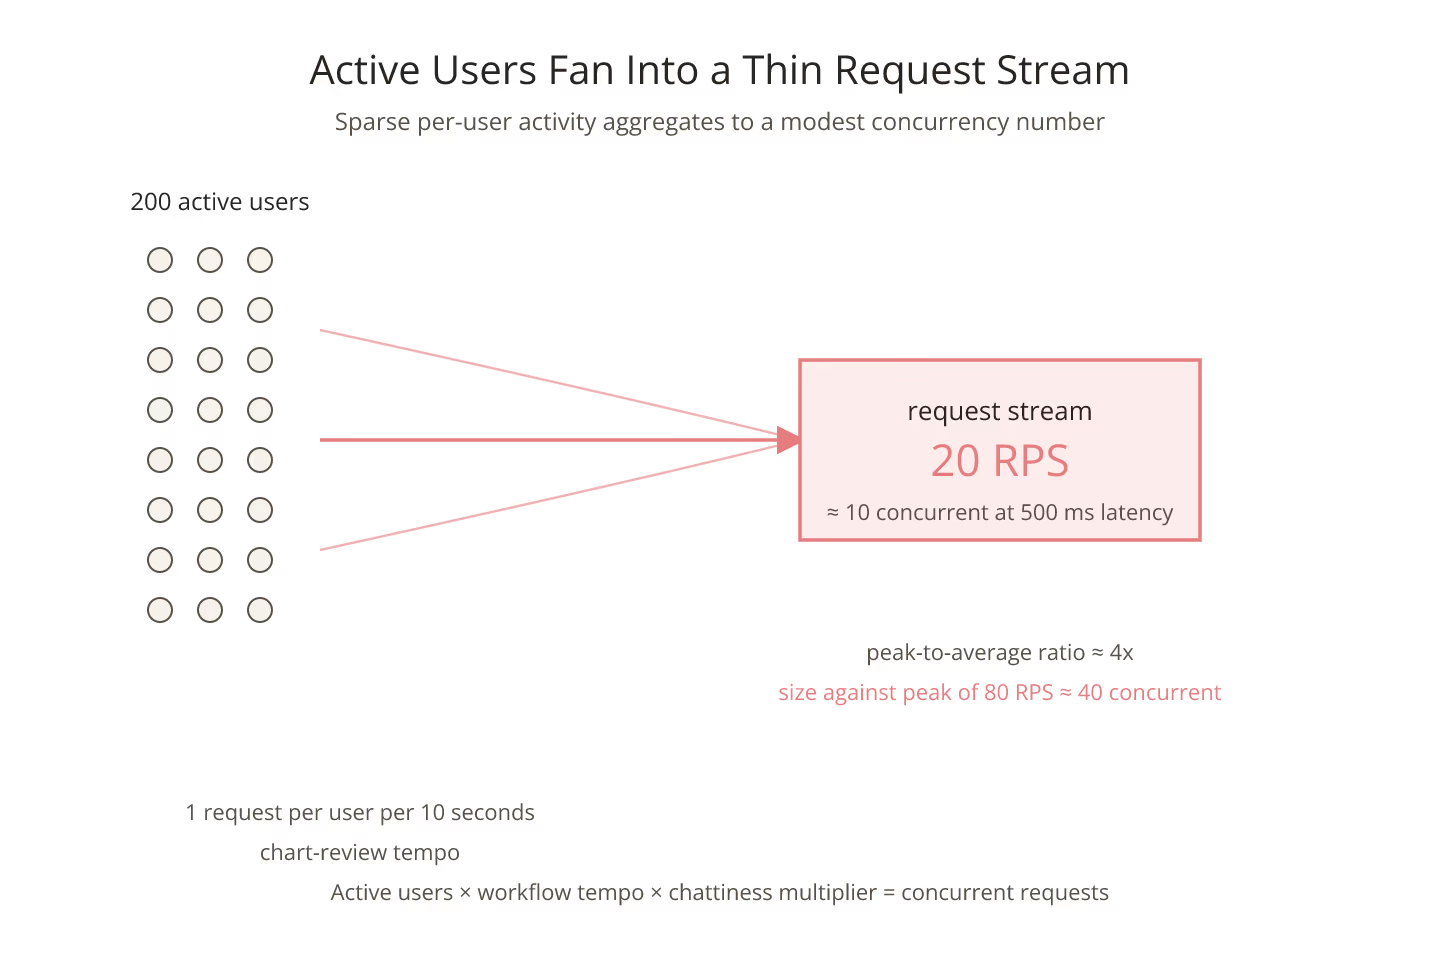
Concurrent requests measure how many HTTP calls are in flight at any moment. A nurse in chart review does not fire a request continuously. She opens a patient, waits ten seconds while she reads, opens the next patient, and so on. The request stream is bursty and low-utilization per user.
Two hundred active users producing one request every ten seconds average to twenty requests per second. Even at ten times burst, they carry maybe fifty concurrent requests. That is a very different sizing target than two hundred. A pass through the site's concurrency p99 predictor turns realistic assumptions into concurrency projections.
The Multiplier Is Workflow-Specific
Different workflows produce different active-user-to-concurrent-request ratios:
- Chart review: 20 to 1 (rare requests, human reading time between them).
- Order entry: 5 to 1 (more frequent interactions).
- Real-time monitoring dashboards: 2 to 1 (constant polling).
- Automated ingestion: 1 to 1 (bots fire requests continuously).
Sizing plans that assume a single ratio across workflows land wrong for at least half of them. The disciplined pattern is to name the ratio per workflow.
The Peak Is What Matters
Averages hide the peaks that break the system. Two hundred active users averaging twenty concurrent requests produce peaks of eighty when a shift change happens or when a critical patient event triggers everyone to open the same chart.
The peak-to-average ratio is typically two to five. Size against the peak, not the average. For the queue-side view of what happens when peaks exceed capacity, queue depth as the leading indicator of trouble covers the shape.
The Chatty Client Multiplier
Client implementations amplify the concurrent-request count. A chatty client fires twenty requests per workflow action; a batched client fires three. Sizing that assumes one request per user action is optimistic.
Estimate the multiplier explicitly per client the deployment serves. For the batch-endpoint version of the same skew, how batch endpoints skew your concurrency estimate covers the shape.
Report Both Numbers Together
The dashboard that shifts sizing conversations shows active users and concurrent requests as two separate metrics. Sizing conversations that only reference user counts miss the multiplier; conversations that only reference RPS miss the workflow context. Both together produce plans that survive.
The Little's Law Connection
Concurrent requests equal RPS times mean latency. A workflow that produces twenty RPS with two-hundred-millisecond latency carries four concurrent requests. The same RPS at two seconds carries forty. For the full framing, predicting concurrency for a FHIR API before you have real users walks through the math.
Naming the split between active users and concurrent requests is the small discipline that keeps the plan from being sized against the wrong quantity.
Sources
- HL7 FHIR core specification of search including _include - HL7 FHIR core specification of search including _include that amplifies per-user request counts
Related Posts