Every FHIR API dashboard eventually converges on a small set of metrics. Latency, error rate, RPS, and utilization sit on the main panel. Queue depth is usually somewhere in the appendix and it should be on the main panel, because queue depth moves first when the system is heading toward trouble.
Naming queue depth as a first-class metric is the small discipline that shortens incident response by fifteen minutes on average. For related walkthroughs, deeper FHIR walkthroughs collects the surrounding material.
What Queue Depth Actually Measures
Queue depth measures how many requests are waiting for a worker to pick them up. Zero means every arriving request finds an available worker. A positive number means arrivals are outrunning capacity.
The metric is available at every layer that queues. The HTTP frontend, the FHIR server's internal thread pool, the database connection pool, and any subscription dispatcher all maintain queues. A pass through the site's concurrency p99 predictor projects utilization against the same underlying capacity model.
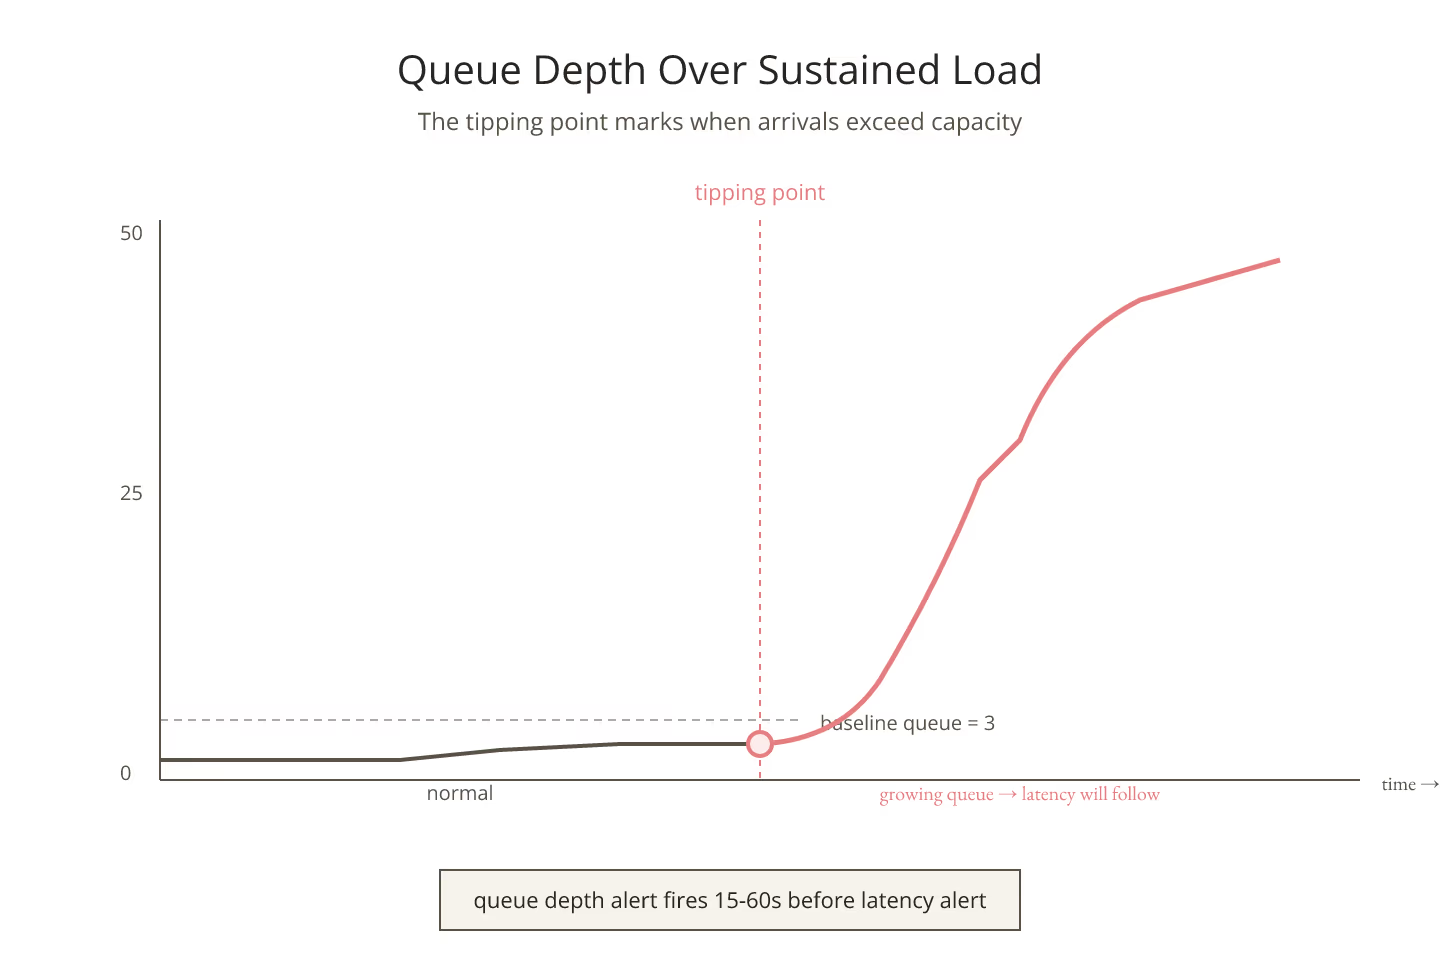
Why It Moves Before Latency
Latency is a lagging indicator because a request waits in the queue before it starts executing. The queue grows first; the tail latency reflects the queue only after the request finishes. Alerting on latency alone gives you notice fifteen to sixty seconds late.
Queue depth grows at the moment arrivals exceed capacity. Alerting on queue depth gives notice immediately. For the wider prediction framing, predicting concurrency for a FHIR API before you have real users covers how to size against this.
The Threshold That Actually Fires
A queue depth of zero is the goal but not the alerting threshold. Alerting on zero produces constant false positives from normal small bursts. A depth of one to five is normal; a sustained depth above ten usually means something is going wrong.
The specific threshold depends on the deployment. Fifteen minutes of load testing gives the number.
The Failure Modes That Grow the Queue
Three failure modes account for most queue growth:
- Downstream slowdown: the database or a terminology server slowed down and every request holds the pool longer than usual.
- Client burst: an ingestion partner started a large export and every request in the pool is now waiting for its slot.
- Contention: interactive traffic is competing with background jobs on the same connection pool.
Each failure mode surfaces as queue growth at a different layer. The dashboard should show queue depth at every layer, not just at the HTTP frontend. For the database layer specifically, concurrency limits that come from the database, not the API covers the deeper story.
Queue Depth vs Latency vs Utilization
The three metrics tell overlapping stories. Utilization tells you the average load; queue depth tells you the burst behavior; latency tells you the user experience. All three matter, and reading them together is what surfaces the shape of a problem.
If queue depth is growing while utilization is moderate, capacity is fine but arrivals are bursting. If queue depth is growing while utilization is high, capacity is saturated. If queue depth is stable but latency is growing, downstream slowdown is the story.
Background Jobs Poison the Queue
Interactive requests competing with background jobs on the same pool is one of the sharpest queue-growth patterns. Background jobs hold pool slots for seconds; interactive requests need slots for milliseconds. The two do not mix on the same pool without one hurting the other. For the specific split, background jobs vs interactive requests in the same FHIR pool covers the pattern.
Alerting Explicitly
Queue depth alerts should ship in the same tier as latency alerts. Every FHIR deployment that reads them together catches problems earlier than the deployments that only alert on latency. Owning queue depth as a first-class metric is one of the cheapest operational upgrades in the sizing playbook.
Sources
- Google SRE Workbook chapter on SLOs and USE method - Google SRE Workbook chapter on SLOs and USE method, canonical queue depth as leading indicator reference
Related Posts